Column-Level Data Profiling for Google BigQuery Datasets — Rittman Analytics
One of the challenges when centralising data from a new source is how to efficiently audit the data it provides, and one of the most fundamental tasks in a data audit is to understand the content and structure of each of those data source tables.
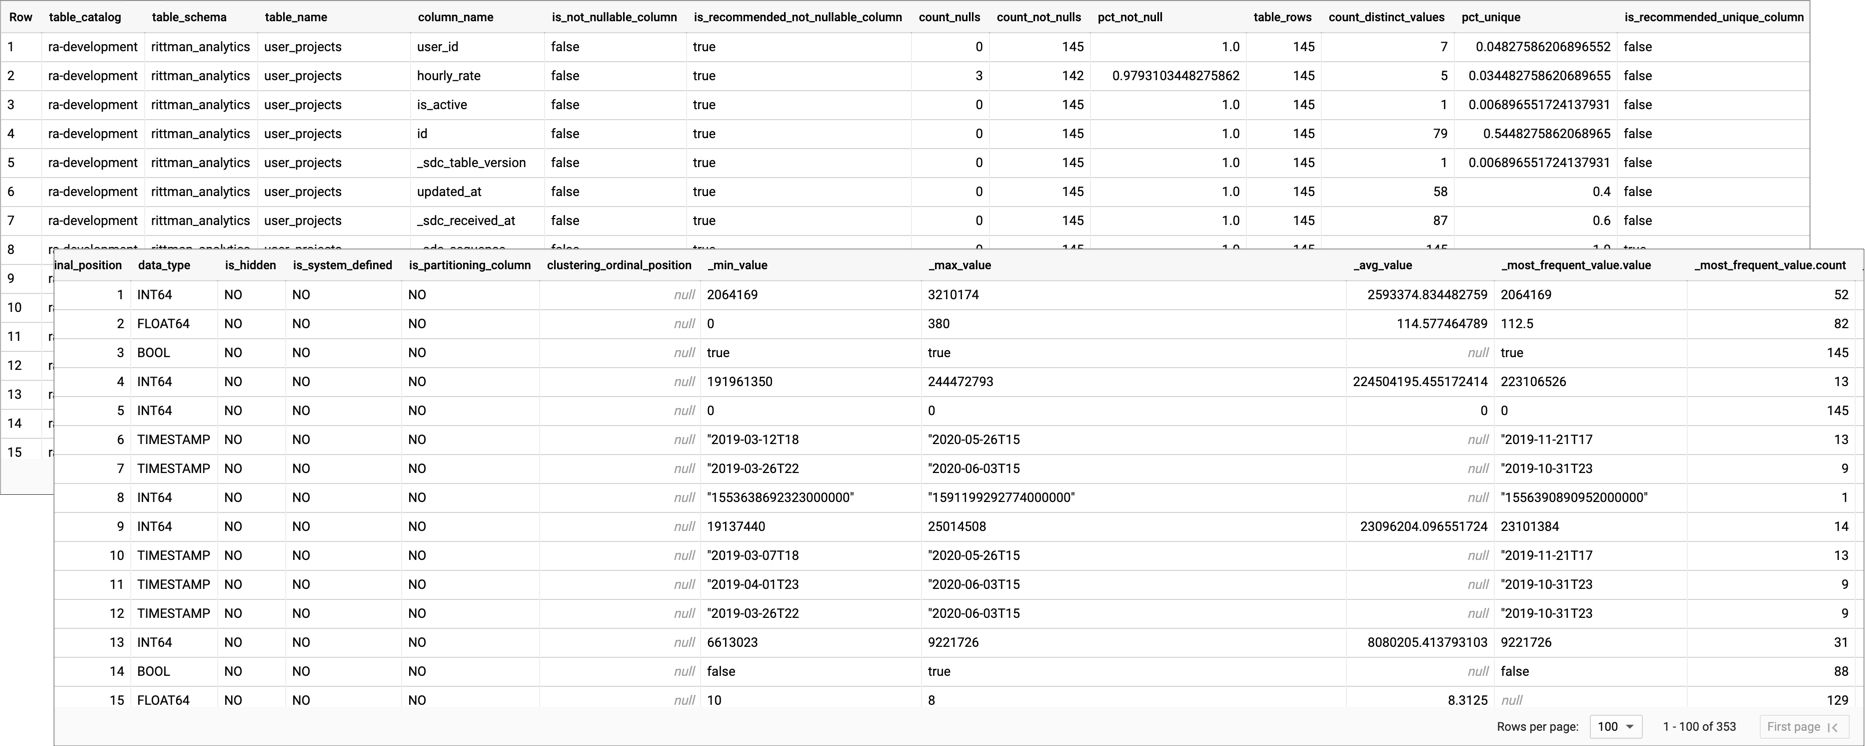
The data profiling feature within the RA Warehouse dbt Framework we blogged about and published to Github last week makes it easy to capture the following column-level object stats and metadata for an entire dataset (schema) of tables and views in Google BigQuery
Count of nulls, not nulls and percentage null
Whether column is Not Nullable
Count of unique values and percentage unique
Data Type
Min, Max and Average values
Most frequently occurring value, and count of rows containing most frequent value
Whether column is used for partitioning
data_profile.png
The profiler also generates two recommendations for dbt model tests:
Based on a configurable % threshold (default 90%) whether the column should be considered Not Nullable
Again based on a configurable % threshold (default 90%) whether the column should be considered as a “unique values” column
You can then use the recommendations generated by the profiler to indicate where you might want to add UNIQUE or NOT_NULL tests into the models section of your dbt schema.yml file, with the small percentage (configurable and set by default at 90%) of non-compliant rows then considered as data errors.
How Does the Data Profiler Work?
Data Profiling is based around a dbt macro that, for every view or table ("relation") in a given schema, generates an SQL query that creates a series of SQL query blocks that generate stats for each database object, unions those queries together and then joins the results to another query against the INFORMATION_SCHEMA.COLUMNS to obtain each object's metadata.
{%- macro profile_schema(table_schema) -%}{{ config(schema='profiles') }}{% set not_null_profile_threshold_pct = ".9" %}{% set unique_profile_threshold_pct = ".9" %}{% set tables = dbt_utils.get_relations_by_prefix(table_schema, '') %}SELECT column_stats.table_catalog,column_stats.table_schema,column_stats.table_name,column_stats.column_name,case when column_metadata.is_nullable = 'YES' then false else true end as is_not_nullable_column,case when column_stats.pct_not_null > {{ not_null_profile_threshold_pct }} then true else false end as is_recommended_not_nullable_column,column_stats._nulls as count_nulls,column_stats._non_nulls as count_not_nulls,column_stats.pct_not_null as pct_not_null,column_stats.table_rows,column_stats.count_distinct_values,column_stats.pct_unique,case when column_stats.pct_unique >= {{ unique_profile_threshold_pct }} then true else false end as is_recommended_unique_column,column_metadata.* EXCEPT (table_catalog,table_schema,table_name,column_name,is_nullable),column_stats.* EXCEPT (table_catalog,table_schema,table_name,column_name,_nulls,_non_nulls,pct_not_null,table_rows,pct_unique,count_distinct_values)FROM({% for table in tables %}SELECT *FROM(WITH`table` AS (SELECT * FROM {{ table }} ),table_as_json AS (SELECT REGEXP_REPLACE(TO_JSON_STRING(t), r'^{|}$', '') AS ROW FROM `table` AS t ),pairs AS (SELECT REPLACE(column_name, '"', '') AS column_name, IF (SAFE_CAST(column_value AS STRING)='null',NULL, column_value) AS column_valueFROM table_as_json,UNNEST(SPLIT(ROW, ',"')) AS z,UNNEST([SPLIT(z, ':')[SAFE_OFFSET(0)]]) AS column_name,UNNEST([SPLIT(z, ':')[SAFE_OFFSET(1)]]) AS column_value ),profile AS (SELECTsplit(replace('{{ table }}','`',''),'.' )[safe_offset(0)] as table_catalog,split(replace('{{ table }}','`',''),'.' )[safe_offset(1)] as table_schema,split(replace('{{ table }}','`',''),'.' )[safe_offset(2)] as table_name,column_name,COUNT(*) AS table_rows,COUNT(DISTINCT column_value) AS count_distinct_values,safe_divide(COUNT(DISTINCT column_value),COUNT(*)) AS pct_unique,COUNTIF(column_value IS NULL) AS _nulls,COUNTIF(column_value IS NOT NULL) AS _non_nulls,COUNTIF(column_value IS NOT NULL) / COUNT(*) AS pct_not_null,min(column_value) as _min_value,max(column_value) as _max_value,avg(SAFE_CAST(column_value AS numeric)) as _avg_value,APPROX_TOP_COUNT(column_value, 1)[OFFSET(0)] AS _most_frequent_value,MIN(LENGTH(SAFE_CAST(column_value AS STRING))) AS _min_length,MAX(LENGTH(SAFE_CAST(column_value AS STRING))) AS _max_length,ROUND(AVG(LENGTH(SAFE_CAST(column_value AS STRING)))) AS _avr_lengthFROMpairsWHEREcolumn_name
<
>
''AND column_name NOT LIKE '%-%'GROUP BYcolumn_nameORDER BYcolumn_name)SELECT*FROMprofile){%- if not loop.last %}UNION ALL{%- endif %}{% endfor %}) column_statsLEFT OUTER JOIN(SELECT* EXCEPT(is_generated,generation_expression,is_stored,is_updatable)FROM{{ table_schema }}.INFORMATION_SCHEMA.COLUMNS) column_metadataON column_stats.table_catalog = column_metadata.table_catalogAND column_stats.table_schema = column_metadata.table_schemaAND column_stats.table_name = column_metadata.table_nameAND column_stats.column_name = column_metadata.column_name{%- endmacro -%}
Then, within each data source adapter (folder within a dbt git repo) you will find a model definition such as this one for the Asana Projects source :
{% if not var("enable_asana_projects_source") %}{{config(enabled=false)}}{% endif %}{% if var("etl") == 'fivetran' %}{{ profile_schema(var('fivetran_schema')) }}{% elif var("etl") == 'stitch' %}{{ profile_schema(var('stitch_schema')) }}{% endif %}
These models when run will automatically create views within the the "profile" dataset (e.g. analytics_profile) that you can use to audit and profile the data from newly-enabled data source adapters (note that you will need to create corresponding model files yourself for any new, custom data source adapters).
There is also a "profile_wh_tables.sql" model within the /models/utils folder that runs the following jinja code:
{{ profile_schema(target.schema) }}
that automatically profiles all of the fact and dimension tables in the warehouse at the end of dbt processing.
See the RA Warehouse dbt Framework on Github for more details, and our Data Centralisation consulting service if you’d like us to implement dbt or a centralized SaaS data warehouse at your organization.
Recommended Posts
An Homage to Oracle Warehouse Builder, 25 Years Ahead of Its Time
Data Lineage for your Google BigQuery, dbt and Cloud Composer Data Pipelines using Dataplex and Data Catalog — Rittman Analytics
One Person Many Roles: Designing a Unified Person Dimension in Google BigQuery
