How Rittman Analytics does Analytics Part 2 : Building our Modern Data Stack using dbt, Google BigQuery, Looker, Segment and Rudderstack.
A couple of years ago I wrote about how we’d started to use Looker, Stitch and Google BigQuery to start building out our own internal analytics capability, and around a year wrote about our use of dbt and our RA Data Warehouse framework to centralise all of our SaaS data sources into Google BigQuery cloud data warehouse.
Two years on and our operational data warehouse now centralises the data from more than twenty SaaS applications, online services and other data sources that it then transforms, integrates and loads into a series of linked subject-area warehouses using conformed dimensions.
As our updated analytics platform architecture diagram shows below, we’re continuing to use Looker but also building-out a BI tool-independent metrics layer using dbt, and we’re also making use of reverse ETL tools from Hightouch and Rudderstack to enrich customer and client profiles in our CRM system, Hubspot.
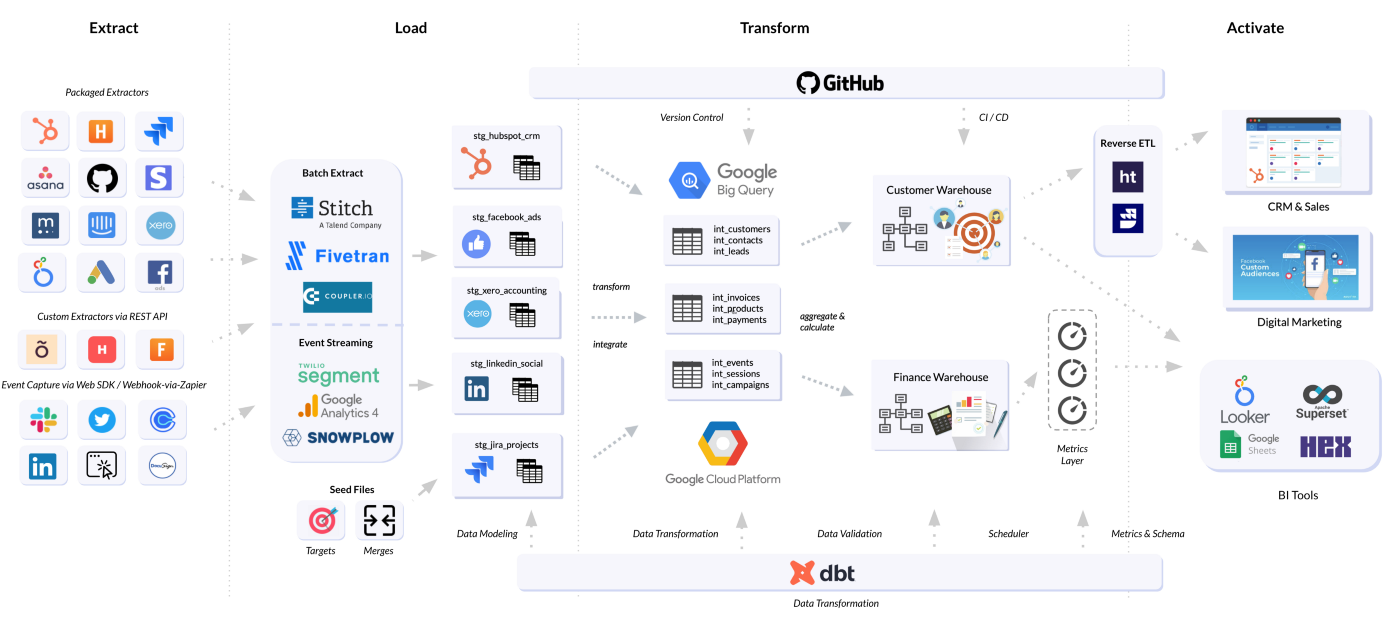
In this blog I’ll walk through the four layers in our internal analytics platform architecture and talk about the approach we’ve taken, tools we’ve chosen and design patterns we’ve created as an example of how one business has gone about creating its own “modern data stack” using dbt, Google BigQuery, Looker and various other tools and an Extract, Load and Transform approach to building and loading a data warehouse.
Extract and Load (“EL”) Warehouse Layer
Like most modern businesses we use a significant number of SaaS applications to run our business and use a mix of data pipeline services to centralize their data in our warehouse; the most straightforward are those that we can bring in using out-of-the-box connectors from our partners at Fivetran and Stitch, landing data in raw form into the warehouse.

For those services with REST APIs but no pre-built connectors we use Coupler.io to connect to those APIs and load data from them in CSV format into BigQuery.

For apps that make their event stream consumable via webhooks or who have a Zapier integration we capture those events either via webhook catches or by setting-up Zapier triggers, then package those events up to match Segment’s HTTP API spec and then forward them on as a real-time event stream via Segment’s Connections customer data infrastucture, routing them to BigQuery as a warehouse destination as well as to other downstream customer and marketing services such as Intercom and Hubspot CRM.

We also use a service called Phantombuster to monitor and scrape social media sites such as LinkedIn and Twitter to capture interactions, comments and profile follows to build-up a profile of our wider audience and the type of topics that seem to drive engagement, feeding that data again using Coupler.io into the warehouse as a hosted CSV or JSON data source
Transform (“T”) Layer
I’ve covered our approach to data centralization and dbt on this blog a number of times before and our design approach is still holding up after integrating our twentieth data source a few weeks ago. We use dbt for modeling, transforming, validating and orchestrating our hourly data load and recently added a metrics layer to help us assess the value in including them as standard in our client delivery projects.

Each data source contains a combination of data that’s unique to that source, for example journal entries in Xero or sales opportunities from Hubspot, together with other data elements that can be found in some or all of the other sources such as details on contacts, companies or projects we deliver.
The dbt DAG below, for example, shows the various sources that combine to provide data for our companies dimension which in-turn is then referenced by almost every other fact table downstream in the data pipeline, allowing us to jump from sales activity to project delivery all the way to NPS scores and retention when analyzing our operational efficiency.

Our dbt design pattern for entity resolution and deduplication combines data from all of our sources of contact information, for example, with those sources enabled by a set of configuration entries in the package’s dbt_project.yml YAML file:
crm_warehouse_contact_sources: ['hubspot_crm','harvest_projects','xero_accounting','mailchimp_email','calendly_discovery','twitter_followers','twitter_likers','linkedin_followers','github_starrers','harvest_forecast','linkedin_commenters','linkedin_likers','asana_projects','jira_projects','docusign_contracts','hubspot_nps','humaans_hr']
Each source of contact information is defined in a separate model within the staging area of our dbt package and named in a consistent way, such that the integration-layer dbt model downstream in the package can union-together those staging models using a Jinja loop and calls to the dbt_utils.union_relations utility macro.
{% if var('crm_warehouse_contact_sources') %}{{config(materialized="table")}}with t_merge_list as({% set relations_list = [] %}{% for source in var('crm_warehouse_contact_sources') %}{% do relations_list.append(ref('stg_' ~ source ~ '_contacts')) %}{% endfor %}{{ dbt_utils.union_relations(relations=relations_list)}})...select...fromt_merge_list{% else %}{{config(enabled=false)}}
For sources that require deduplication and may require over-rides to be specified to merge records that otherwise wouldn’t merge on just name, we provide a seed file of IDs that need to merge along with files of targets and other reference data that we then include and load in each time the warehouse refresh runs.
The second dbt project DAG shown below shows how data on contacts is sourced from virtually every data source we ingest and then used to link-together all of that contacts’ engagements with our business and channels of communication.

Using this dbt design pattern and the first-party data we collect gives us the ability to create complete 360-degree profiles of clients interests and engagements with our services and social media accounts.

Data Warehouse Data Models
Data for analysis is then separated into a series of subject area warehouses that link-together through common dimensions such as contact, customer and project, with the overall warehouse data model its subject areas shown in the data model diagram below.
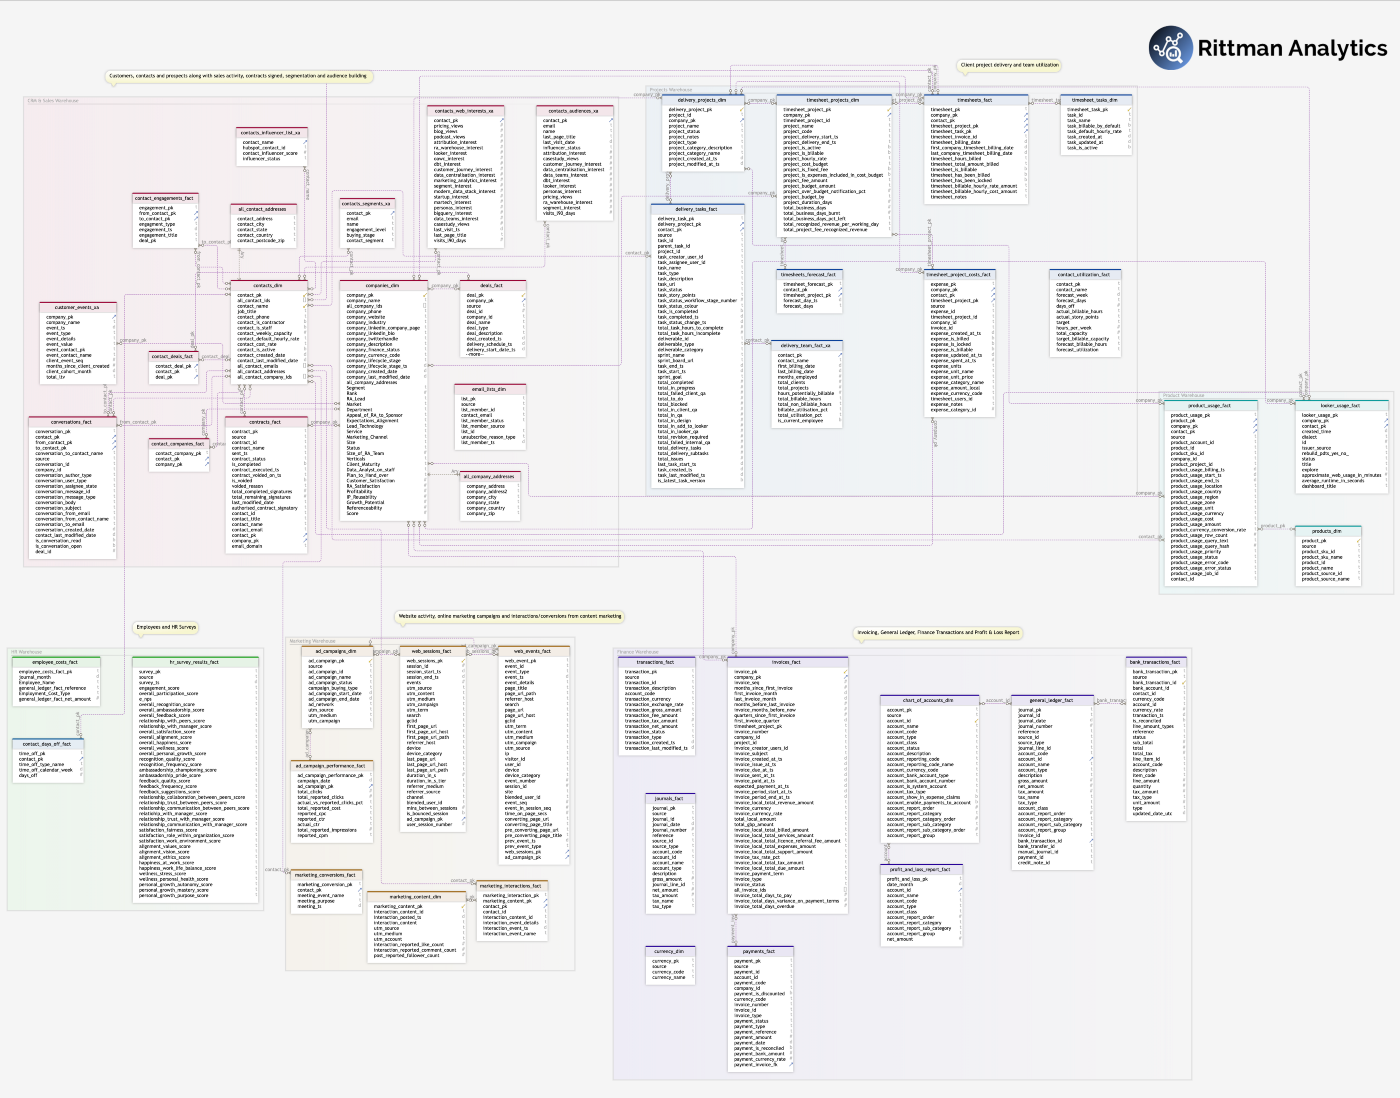
Stepping through each subject warehouse in-turn, the Sales and CRMWarehouse is the most central of the subject area warehouses and contains customer and contact details together with calculated segments, channel and product preferences together with fact tables listing sales deals, communications and a complete event-level customer behavioral history

Next, our Finance and InvoicingWarehouse sources from Xero, Harvest (our timesheet system) and Stripe and is used primarily for P&L reporting and calculating individual project profitability.

Next, our Marketing Warehouse stores all ad campaign and ad spend data along with content marketing and social media interactions, with a separate warehouse and dbt package we’ve also created for ad spend and revenue attribution, campaign RoI and customer cost-of-acquisition.

The other main subject area and the one that’s most consulting services-specific is our Projects Warehouse, sourcing data primarily from Harvest (our timesheets system) Jira and Docusign for contract activity, and is used for calculating our team’s utilization and resource forecasts.

Other subject area warehouses include an HRWarehouse (with sensitive and personal data stores in a separate, restricted access GCP project) as well as a Product Usage Warehouse into which we stream log and usage data from our GCP projects, Looker and BigQuery accounts and log data from Fivetran.

Activation and Analysis Layer
The last but probably most important layer is the Activation and Analysis Layer where data is presented for analysis in the form of Looker dashboards, looks and explores; recently we’ve also been playing-around with an open-source Looker clone called Lightdash that we covered on this blog a few weeks ago that uses the dbt metrics layer I mentioned earlier in this article as its business semantic model.

For specific use-cases we use specialist consumption tools for tasks they’re better suited for, for example the notebook service Hex that we used a couple of weeks ago to create the externally-facing data app I’ve embedded below, for example, to publish the listener stats for our podcast Drill to Detail.
Finally and as we covered in our blogs on Customer 360 Data Warehousing and Sync to Hubspot using BigQuery, dbt, Looker and Hightouch andWhen and How Data Warehouses are the New Customer Data Platform, we sync the customer segments, content preferences and other calculated attributes from our warehouse back into our CRM and other marketing platforms using reverse ETL tools from Hightouch and Rudderstack, updating each system’s contact records using contact email as the common point of reference.

Interested? Find out More
Rittman Analytics is a boutique analytics consultancy specialising in the modern data stack who can help you centralise your data sources and enable your end-users and data team with best practices and a modern analytics workflow.
As example code we’ve made the dbt package used to build our internal data warehouse available as a public git repo on our Github account and you’re free to check out how we’ve approached delivering our own data warehousing and data centralization project.
And, of course, if you’re looking for some help and assistance building-out your analytics capabilities or data warehouse on a modern, flexible and modular data stack, contact us now to organize a 100%-free, no-obligation call — we’d love to hear from you and see how we might help you and your team build your own modern, ETL-style operational data warehouse.