Introducing Conversational Analytics, Data Agents and Code Interpreter in Looker and Looker Studio
Conversational Analytics is Google’s implementation of AI-powered natural language querying for Looker and Looker Studio. At its core, it enables users to interact with their data using everyday language rather than having to learn SQL or navigate complex dashboard interfaces.
The goal for conversational analytics is to further democratise data access. By allowing users to simply type questions like “What were our top-selling products last quarter?” or “Show me website traffic trends by channel over the past six months,” Conversational Analytics is like having a data analyst available 24/7 who already understands your business context.
What’s particularly powerful is how Conversational Analytics leverages Looker’s semantic layer. This ensures that everyone in the organization is using the same metric definitions and business rules, eliminating the “multiple versions of the truth” problem that plagues many analytics implementations
Chat with Looker’s Trusted Metrics Store
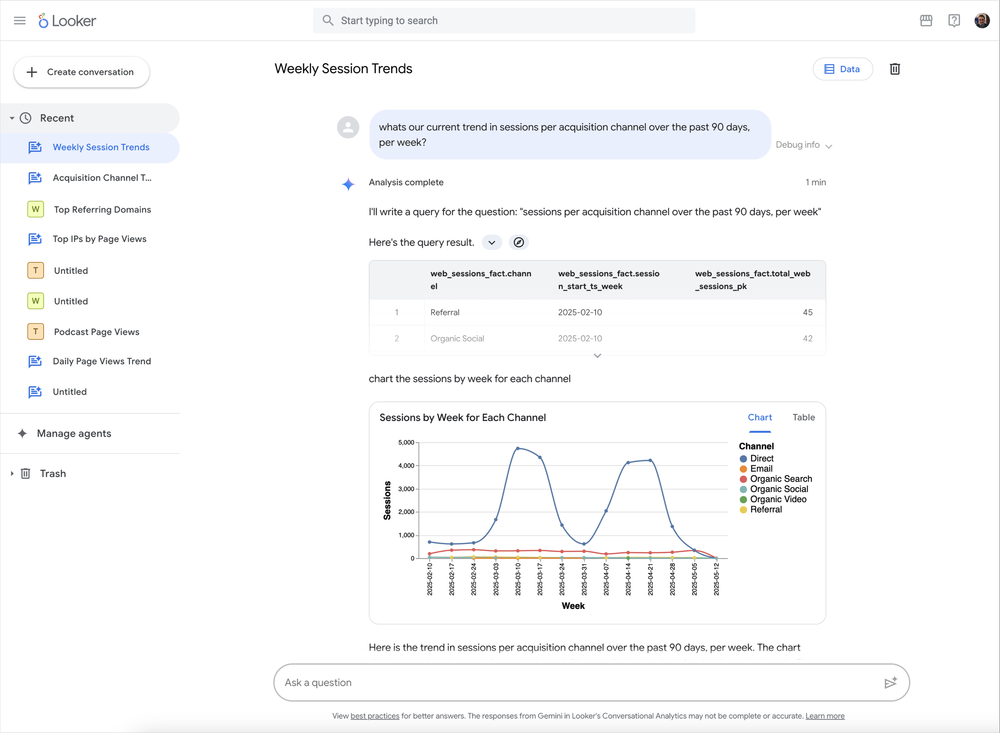
In Looker, once your Looker admin has enabled Gemini in Looker and granted you the Gemini role, you can access Conversational Analytics from either the Looker homepage or from an explore (analysis) page, and in all cases you pick a particular Looker explore as the starting point for your conversation.
From that point on and as shown in the screenshot before, you can carry on a typical questions-and-answers conversation with the data exposed by your explore, with the history of previous questions and answers within that particular conversation available as context for whatever question you answer next.
Creating Conversational Analytics Data Agents
Although the Looker semantic layer provides a more governed and descriptive chatbot datasource than you’d typically get with a database schema, there still could be a number of different metrics with “revenue” in their name when your business always reports using net revenue, for example.
Or there could be specific calculation formulae that the Conversational Analytics wouldn’t know about by default, and of course Conversational Analytics doesn’t know the context for your questions or the type of analyst role you’re expecting it to adopt when answering your questions.
Conversational Analytics also therefore gives you the ability to create customized data agents for specific use cases. These agents are essentially specialized assistants that combine domain-specific knowledge with data access.
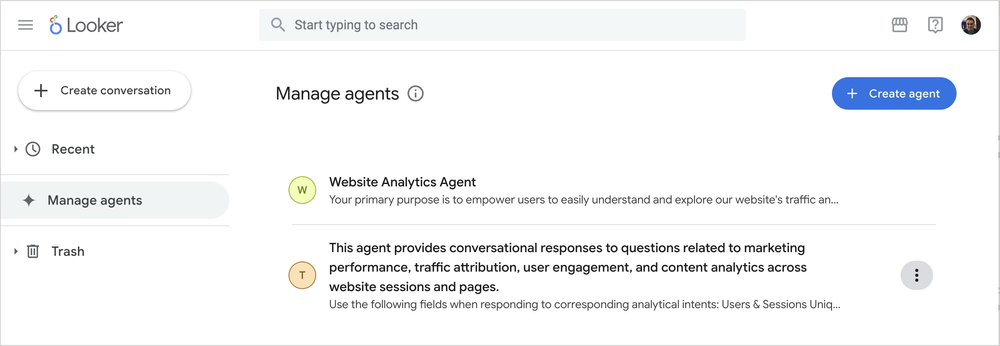
To create a data agent:
-
Navigate to Conversational Analytics in Looker Studio or Looker
-
Press + Create agent in the + Create Conversation section
-
Provide an agent name and description that clearly explains its purpose
-
Connect to a data source (BigQuery table, Looker Explore, etc.)
-
Add instructions to help the agent understand your data context
The instructions field is where you customize the agent’s understanding of your data, and is crucial for getting accurate and relevant responses. Some effective instruction types include:
-
Synonyms: “If someone says ‘revenue’, use the ‘total_sales’ field”
-
Key fields: “The most important fields are order_id, customer_id, and order_date”
-
Filtering guidance: “Unless stated otherwise, always filter data for the current year”
-
Business definitions: “We consider ‘loyal’ customers to be those with more than 5 orders”
An approach I’ve been using to create these instructions is to make use of the LookML you can export from a KPI dashboard and have Vertex AI create the instructions using that LookML and a screenshot of the KPIs in the dashboard, as a reference:
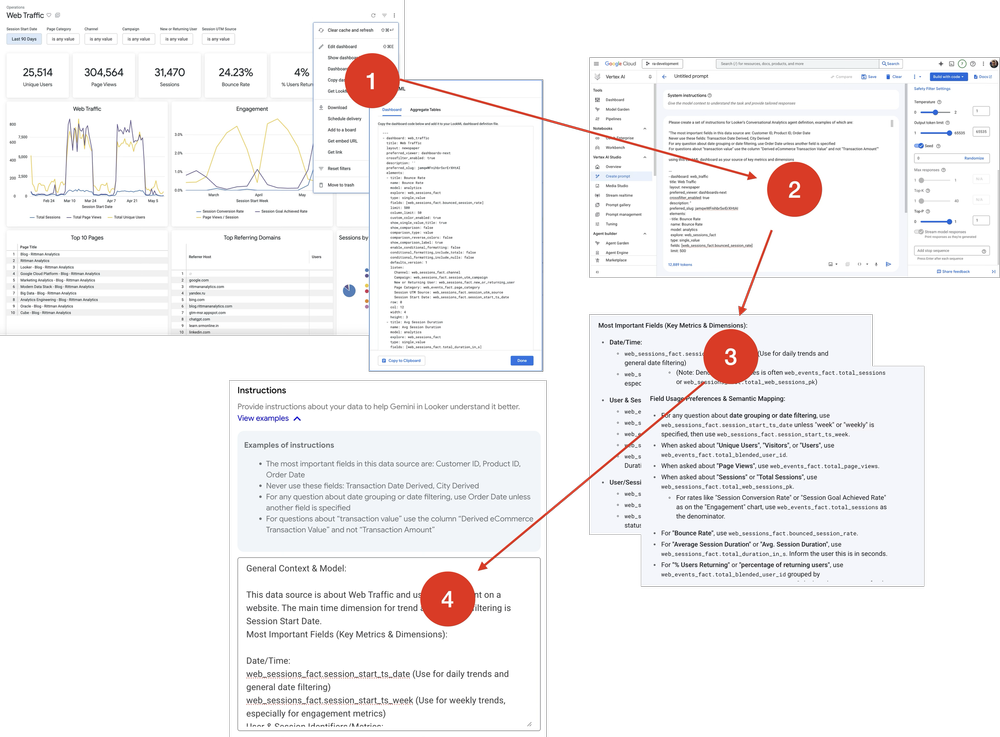
“Priming” an agent in this way gives it a lot more context and guidance on what fields in the explore are important to you, making its answers to your questions more relevant and correct.
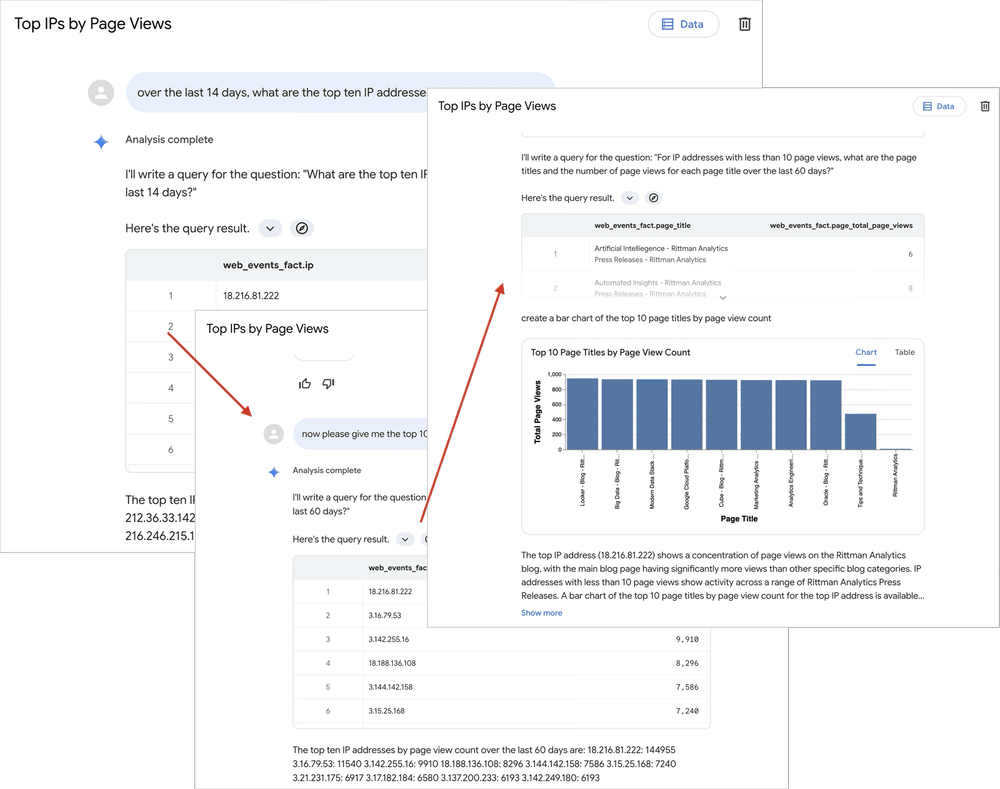
Using these instructions and the data from your Looker explore or Looker Studio data source, Conversational Analytics is particularly good at handling questions that can be answered with a single visualization:
-
Metric trends over time (“How have sales changed over the past 12 months?”)
-
Distributions (“What’s the breakdown of orders by product category?”)
-
Top/bottom performers (“Show me our top 10 customers by revenue”)
-
Simple comparisons (“Compare website traffic across our main channels”)
-
Basic aggregations (“What’s our average order value?”)
As with any new technology, there are some limitations to be aware of:
-
Data limits: For Looker data, queries are limited to returning a maximum of 5,000 rows
-
Visualization constraints: While basic chart types are well-supported, more complex visualizations like heat maps may have inconsistent behavior
-
Question complexity: More advanced analytical questions (period-over-period analysis, statistical analysis) aren’t supported in the base implementation
-
BigQuery limitations: Conversational Analytics doesn’t support BigQuery’s Flexible Column Names feature
Advanced Analytics using Code Interpreter
If you’re looking to push beyond the standard capabilities, Looker Studio (like tools such as Claude and ChatGPT) offers an experimental Code Interpreter feature that significantly extends what’s possible with Conversational Analytics.
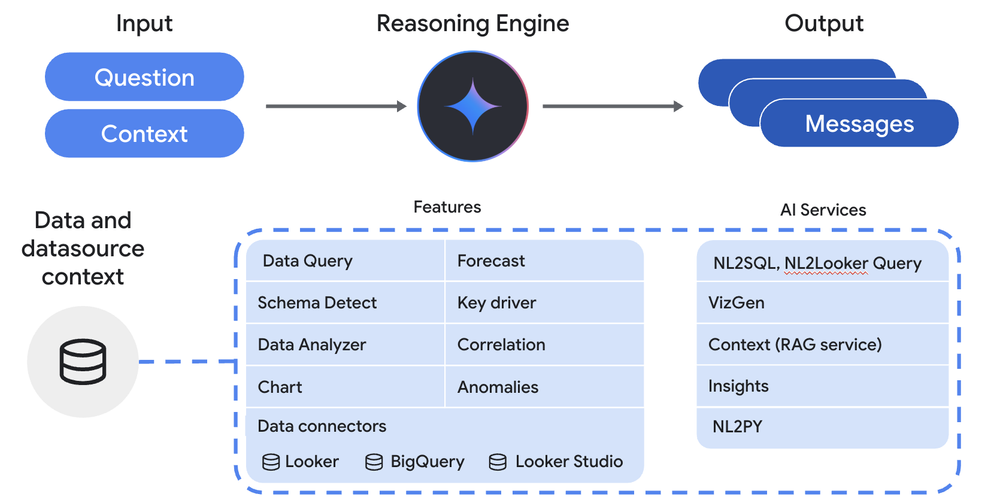
Code Interpreter translates natural language questions into Python code and executes that code to provide advanced analysis and visualizations. This bridges the gap between the simple SQL-based queries that Looker and Looker Studio normally generate and more sophisticated data science techniques.
To enable the Code Interpreter:
-
Navigate to Conversational Analytics in Looker Studio
-
In the left navigation panel, click the Advanced analytics toggle
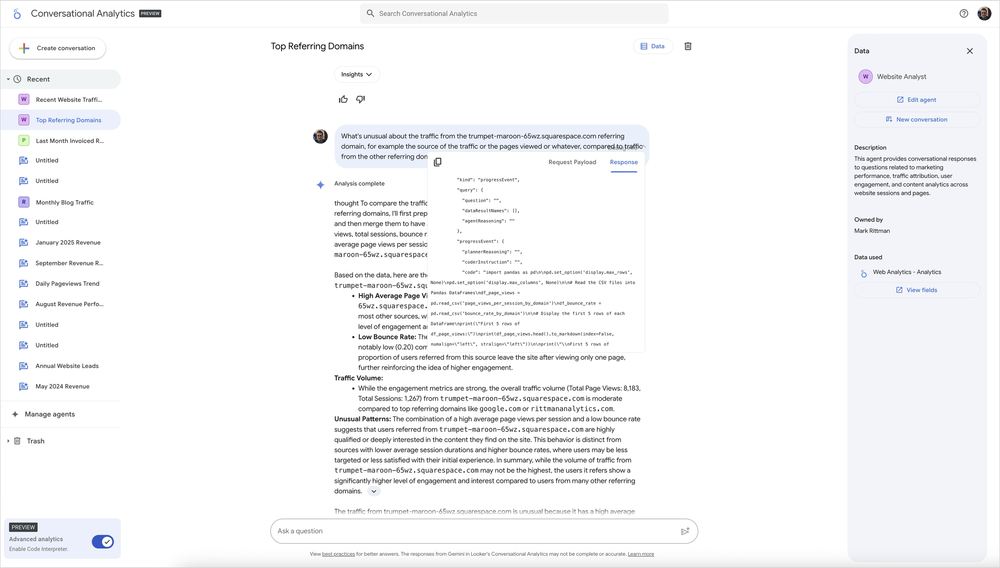
As you can see in the screenshot below you can also choose to view the setup instructions the Code Interpreter feature is sending to its Python execution environment, and the resulting depth of analysis provided by the Conversational Analytics agent is now greater than with Conversational Analytics answers.
With Code Interpreter enabled, the range of questions you can answer expands dramatically to include:
-
Period-over-period comparisons (“How do sales this year compare to last year?”)
-
Identifying outliers and anomalies (“Find unusual patterns in our website traffic”)
-
Cohort analysis for understanding customer retention
-
Calculating compound annual growth rates by product category
-
More sophisticated visualizations using libraries like matplotlib and seaborn
The Code Interpreter supports numerous Python libraries including pandas, numpy, scikit-learn, and tensorflow, enabling advanced statistical analysis and even machine learning techniques.
INTERESTED? FIND OUT MORE!
Rittman Analytics is a boutique data analytics consultancy that helps ambitious, digital-native businesses scale-up their approach to data, analytics and generative AI.
We’re authorised delivery partners for Google Cloud along with Oracle, Segment, Cube, Dagster, Preset, dbt Labs and Fivetran and are experts at helping you design an analytics solution that’s right for your organisation’s needs, use-cases and budget and working with you and your data team to successfully implement it.
If you’re looking for some help and assistance with your AI initiative or would just like to talk shop and share ideas and thoughts on what’s going on in your organisation and the wider data analytics world, contact us now to organise a 100%-free, no-obligation call — we’d love to hear from you!
Recommended Posts
Introducing Conversational Analytics, Data Agents and Code Interpreter in Looker and Looker Studio

Rittman Analytics 2025 Wrapped : A Year of Platforms, People and High-Performing Data Teams
Claude Meets Looker: Building Smarter, Connected Analytics with Google’s MCP Toolbox