Medium, Squarespace (or Github?) : Content Marketing Value Analytics using Looker, dbt and Segment
If you’re reading this article on our Medium.com blog blog.rittmananalytics.com.com, you may not be aware that we also cross-post these blog posts to our own company website, at https://rittmananalytics.com/blog.

We cross-post blogs from Medium.com to our own Squarespace-hosted site partly to make our content available across as many channels as possible, but also because we assume that content published on our own site has more chance of “converting” into a new sales enquiry than content hosted on a third-party site such as Medium.com.
But is that assumption correct? Or does an aggregator site such as Medium bring in a different type of audience who have a greater propensity to convert than visitors to our website coming in most cases via organic search?
Does Medium.com’s design, readability and ability to recommend our articles to readers with an interest in the topics we write about lead to more of those articles being read through to the final call-to-action that’s at the end of all our blog posts?
As a data-driven analytics consultancy with our own modern data stack, in this blog I’ll walk through how we took data from the blog on our site collected in this case using Segment along with data from Medium we were able to extract and scrape, how we transformed, standardised and integrated those datasets using dbt and then answered our own question using a series of looks and analyses created using Looker.
Medium.com does have a REST API that we could use to extract a list of our articles, publications and counts of article claps (analogous to ‘likes’), but for convenience we use scraping service PhantomBuster along with Airbyte to first extract the details of our blog posts, post dates and clap counts in CSV form, then load in raw form into our BigQuery data warehouse in a format that reflects the scraping and Medium.com APIs that this tool uses.
We actually use two separate tasks, or “phantoms”, to perform this task with the second automatically run on completion of the first;
An initial phantom that searches for all posts from Rittman Analytics and returns the post title, URL and aggregated stats for reads, imcodessions and claps (likes)
A second phantom, “chained” to the completion of the first one, that gives us the name and public profile URL of each article’s clappers (likers), but not their email addresses or any personal or contact information.
Displaying this data from Medium as a Looker table visualization is a useful start and shows me the overall popularity of the blogs we’ve published on Medium; articles I wrote back in 2018 on Google BigQuery table partitioning and using Looker to analyze Monzo bank transactions have historically been the most popular … but did this popularity translate into visits to our website and new leads?

Answering this business question on the outcome and results of our blogs and content requires us to source and derive a further set of data points:
Page view and other event data captured on our main website using Segment, giving us details of any referral sessions coming over from our Medium site (note that Rittman Analytics is a Segment Select Channel Partner specializing in Multi-Touch, Multi-Source Marketing Attribution)
Some method of scoring that referral traffic and identifying conversions, so that we can work out whether the traffic coming across from Medium is useful from a marketing and lead-generation perspective
A way of joining these two datasets together, so that we can link back from that referral traffic back to the data we have on our Medium posts to work out whether claps correlate to project enquiries, and if certain topics work better than others in terms of generating interest in our services.
We’re already capturing page view and track event data coming from Segment and storing it in two fact tables in our warehouse, one at event level and another with those events organized into user sessions.
We can see what sessions had originated by visitors coming over from our Medium site by filtering on the referrer_host column in our sessions fact table.
SELECT
  *
FROM
  `ra-development.analytics.web_sessions_fact`
WHERE
  referrer_host IN ('blog.markr320.sg-host.com','medium.com/mark-rittman')
ORDER BY
  session_start_ts
LIMIT
  10
Within the LookML view we create over this warehouse table in Looker we add a further virtual column, or “LookML dimension”, that categorises page view events as blog or podcast article views or more interestingly for us, as views of marketing or services pages.
dimension: page_category {
    group_label: "Behavior"
    type: string
    sql: case when ${event_type} = 'Page View' then
              case when ${TABLE}.page_url_path like '%blog%' then 'Blog'
                   when ${TABLE}.page_url_path like '%drilltodetail%' or
${TABLE}.page_url_path like '%podcast%' then 'Podcast'
                   when ${TABLE}.page_url_path = '/' or
${TABLE}.page_url_path like '%home-index%' then 'Home Page'
                   when ${TABLE}.page_url_path is not null then 'Marketing' end
              end;;
  }
For visitor events coming from our site that aren’t page views we flag those that we’d consider “conversion” events, at the time of writing any events with “Button” in the event name (“Contact Us Button”, “Contact Button”, “Button codessed” and so on), and create a measure counting those events in order to measure our session and visitor conversion rates.
dimension: is_conversion_event {
    type: yesno
    group_label: "Behavior"
    sql: ${event_type} like '%Button%' ;;
  }
measure: total_conversions {
type: count_distinct
sql: ${web_event_pk} ;;
filters: [is_conversion_event: "Yes"]
}Finally, all of that information is then combined in another LookML dimension that calculates the visit value of each website event, using logic that assigns a value of 1 for other content page views but doubles in-value for other event types that correspond to stages in our lead capture funnel, with a measure that aggregates this visit value in order to then calculate the average visit value for sessions and users.
dimension: visit_value {
    type: number
    hidden: yes
    sql: case when ${page_category} in ("Blog","Podcast") then 1
              when ${page_category} = "Home Page" then 2
              when ${page_category} = "Marketing" then 4
              when (lower(${event_type}) like '%collateral%' or
lower(${event_type}) like '%pricing%') then 8
              when lower(${event_type}) like '%button%' then 16 end;;
  }

measure: total_visitor_value {
    type: sum
    sql: ${visit_value};;
  }
If we then want to plot this value by months since each blog article was posted, we need to find a way to join the article data from Medium with the referrer URL data for each visitor event coming from Segment; the challenge is that that by default those URLs don’t match-up and return rows in a SQL join:
Article URLs given to us by Medium for us are in the format //blog.markr320.sg-host.com/<article_stub> and //medium.com/mark-rittman/<article_stub>
Within our Segment page event data, Medium uses the URL format //medium.com/article/<article_stub> regardless of whether the traffic came from our Medium publication or my personal Medium page
Working around these mismatching URL formats we extract just the article stub string from the Segment page event referrer column in the relevant LookML view, like this:
dimension: referrer_article_stub {
    group_label: "    Acquisition"
    type: string
    sql: case when ${referrer_source} = 'Medium' and ${referrer_host} =
'blog.markr320.sg-host.com' then split(${referrer},'/')[safe_offset(3)]
              when ${referrer_source} = 'Medium' and ${referrer_host} =
'medium.com' then split(${referrer},'/')[safe_offset(4)]
end ;;}and then do the same for the LookML dimension that contains the blog article data from Medium, like this:
dimension: article_stub {
    primary_key: yes
    type: string
    sql: case when ${utm_source} = 'medium' then split(${post_url},'/')[safe_offset(4)]
              when ${utm_source} = 'squarespace' then ${post_url} end ;;
  }
We can then create a Looker visualization such as that shown below that displays, over time, the cumulative visit value generated by each Medium blog over the months since each was first published.
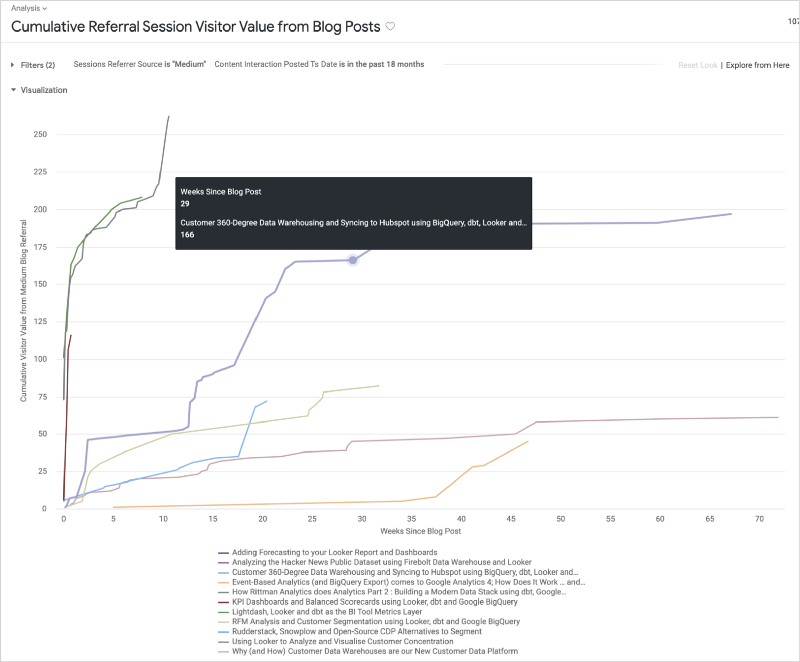
Calculating growth or “ramps”-style data visualisations such as this requires two more data items:
A LookML dimension containing the number of months since a reference date or timestamp that the event or transaction happened on; for our example this is the number of months from the original date of each blog’s original posting that the visitor event happened on (“Weeks Since Blog Post” in the chart’s X axis), something that we can now calculate since we’ve joined our Medium and Segment, like this:
dimension: referrer_days_since_post {
    group_label: "    Acquisition"
    type: number
    sql: case when ${referrer_article_stub} is not null then timestamp_diff(${event_ts_raw},${marketing_content_dim.interaction_posted_ts_raw},DAY) end ;;
  }
2. A table calculation that returns the running total (cumulative sum) of the measure you’re interested in, except in cases when that value is null in which case it also returns null; this is required in order to have each “ramp” curve terminate when there is no more data available for it

We can also use this data to calculate the ratio of claps : visit value delivered and claps : visitor conversions for each article, useful for us to understand for what category of topics positive feedback for an article translates to enquiries for our services.

Whilst our Squarespace site doesn’t comes with an API that lets us directly extract the names, URLs and posting dates for blogs we’ve cross-posted from Medium, once loaded into our BigQuery data warehouse we can derive that data by filtering Segment page events data to just those page events that have ‘/blog/2’ in the page URL, grouping the results and then taking the minimum timestamp value for those page events as the implied date the blog was posted.
WITH pages AS ( SELECT page_title, SPLIT(page_url_path,'/')[safe_OFFSET(5)] AS article_stub, MIN(event_ts) posted_at_ts FROM {{ ref('stg_segment_events_page_events' ) }} WHERE page_url_path LIKE '%/blog/2%' AND page_title != 'Rittman Analytics' GROUP BY 1, 2), first_post AS ( SELECT *, ROW_NUMBER() OVER (PARTITION BY article_stub) = 1 AS is_first_post FROM pages ), content as ( SELECT * FROM first_post WHERE is_first_post),
If we then combine the standardised version of this data with the data we extracted earlier from Medium, our downstream warehouse tables now contain data on both the original and cross-posted versions of each article.

Now I can calculate the cumulative visit value returned for just a single post but across both Medium and Squarespace as sources of referrer traffic; interestingly, whilst the Medium-hosted version of the post outperformed the Squarespace-hosted version for the first two months after publication, the Squarespace version continues to provide high-quality referral traffic.

The Medium-hosted version of that blog flatlined after a month and was overtaken by the Squarespace version a few weeks later; perhaps this was due to Medium ceasing to recommend this post to readers who weren’t otherwise subscribers to our blog, a network effect we get benefit from when posting to a content aggregator site such as Medium.com.
If we now extend this data from just that captured from Medium and Squarespace to sources such as LinkedIn, Twitter and Github, we can get a full picture of the relative popularity of our blog articles and links to those articles published on each of these social networks.

If we also factor-in traffic that comes directly to us and via organic (Google, Bing-etc) searches, the latter two still contribute the vast majority of our conversions with direct traffic more likely to result in a meeting being booked than traffic coming from either of our blog sites.

This is most likely because anyone visiting our site via typing it into their browser address bar is visiting our site for a business reason, and search traffic is similar in-reason although this does serve as a reminder for us to not forget SEO optimization when trying to generate more leads for our business.
Taking that same set of data and charting the average visit value for each referral source we can see that visits originating from Medium (and LinkedIn) are above average in-terms of session visit value, and company-hosted blog page referral traffic is below-average in value.

Finally though, visualizing the full set of metrics including session conversion rate and average value delivered we can in-fact see that our most valuable source of referral traffic is in-fact our Github team site, where we’ve uploaded open-source dbt packages for the types of data centralization tasks we talk about on these blog articles as well as example dbt code for projects such as multi-touch, multi-cycle marketing attribution.

INTERESTED? FIND OUT MORE
Rittman Analytics is a boutique analytics consultancy specializing in the modern data stack who can help you centralise your data sources and enable your end-users and data team with best practices and a modern analytics workflow.
Hopefully this look at how we try and measure the impact and value of our blogging activity has been of interest to you as a reader of this blog —our motivation when writing articles is of course really about a love for the topic and desire to share learnings but as data specialists, we also love measuring and analyzing our activity and using it to make that activity more effective and valuable.
If you’re looking for some help and assistance understanding the impact and value delivered by your content or other marketing activity, or to help build-out your analytics capabilities and data team using a modern, flexible and modular data stack, contact us now to organize a 100%-free, no-obligation call — we’d love to hear from you!