Media Analytics for the Drill to Detail Podcast using Looker, Fivetran and Mixpanel
Most readers of the MJR Analytics blog will no doubt be aware of the Drill to Detail Podcast on the big data analytics industry that we present and host, with the most recent episode covering the Looker JOIN 2018 event in San Francisco with Tristan Handy and Stewart Bryson as special guests. Things have been a bit busy over the past month with the launch of MJR Analytics and then the Looker and Oracle conferences but we try and upload a new episode every few weeks, with the next episode — fingers crossed — having a rather special guest if we can get our schedules aligned.
Listeners to the show typically either use services such as Apple’s iTunes Podcast Directory to download episodes and play them typically on their iOS mobile devices or they can visit the show’s website at https://www.drilltodetail.com where they can download or play episodes through an embedded audio player and click through the links in the show notes that accompany each episode.
Apple provides statistics at episode level to podcast owners via their new Podcast Analytics service but you’re limited to just the charts and fixed ways that the app allows you to analyze and explore your dataset. If you can find a way to scrape or download this data and load it into a database service such as Google BigQuery though, then you could instead use a tool such as Looker to analyze and visualize your listener data in more interesting ways that are also very applicable to customer and product analytics for any digital or eCommerce site, as I’ll explain as we go through the examples.
To start, the Looker visualization below shows for each episode of the show how many in-total of that episode were listened to by users of Apple’s Podcasts Directory service on their iPhones, iPads and Mac OS devices, with the single most listened-to episode of all time within a given month being our 50th Episode Special that featured Stewart Bryson and Alex Gorbachev as our two special guests.

1_ilhCgPXXaqpil4tKSkJd2g.png
Apple also provide data on the how much of each episode was completed by the listener, so you can get a sense of how long episodes should last and how engaged your audience was with individual episodes. In the Looker visualization below you can see that typically our listeners get through around half to two-thirds of each episode but were particularly engaged with Wes McKinney episode on Apache Arrow, Python Pandas and his blog post comparing Arrow with ORC and Parquet that was generating a lot of discussion in the open-source and big data community at the time.

1_mzVle2MGHq9KlDgpwB7aQQ.png
So far the way I’ve analysed downloads and listener numbers for the podcast is not too dissimilar to how businesses used to only measures sales per month but didn’t really think about how many of their customers and visitors coming onto their site each month were new or in-fact returning customers looking to buy more.
These days knowing how many of your customers are new or returning is the first thing you’d want to understand as an eCommerce manager because it’s cheaper to sell to an existing customer than to go out and recruit a new one, and one of your main priorities is to try and turn those first-time buyers into loyal, repeat purchasers who then become your most valuable customers.
My focus on episodes rather than listeners was in-reality more due to Apple not providing episode download and listening data at the granularity of an individual user or device ID, but some time ago I also set up Mixpanel, a Javascript event-tracking service similar to Heap and Google Analytics’s custom events, to track when visitors played episodes of the show on the site through their browser as shown in the screenshots below.

1_9-dnYMTQqFJ1E-pfBnmNDg.png
Data is still only logged at unique device level as there’s no registration facility on the site or other means to tie downloads to particular users, but now we have access to additional details of each download such as where the user was located and what type of browser and OS they were using.
Mixpanel stores the events it tracks in a database service it hosts, but you can use a managed data replication service such as the one from our partners at Fivetran, shown in the screenshots below, to copy that data into a warehousing platform such as BigQuery as I’ve done and shown below.

1_NmcCG2ET75sX-M4htrOO7Q.png
Going back to Looker I now create two new LookML views against the single table of Mixpanel tracked events that Fivetran replicated into BigQuery for me, the first of which is keyed on the unique distinct_id columns and contains dimensions and measures for the listener’s device used for accessing the site and playing-back episodes of the show.
view: unique_devices {derived_table: {sql: SELECTdistinct_id,device,mp_country_code,os, region, screen_height, screen_widthFROM`aerial-vehicle-148023.mixpanel.event`WHEREname IN ('Clicked Nav Link','Podcast Episode Played')group by 1,2,3,4,5,6,7 ;;}dimension: distinct_id {primary_key: yeslabel: "Device ID"}dimension: device {sql: case when ${TABLE}.os in ('Windows','Mac OS X','Linux') then 'Desktop'when ${TABLE}.os = 'Chrome OS' then 'Chromebook'else device end;;}dimension: os {}dimension: region {}dimension: screen_height {}dimension: screen_width {}dimension: mp_country_code {label: "Country"}measure: count_unique {type: count_distinctsql: ${TABLE}.distinct_id ;;}measure: count {type: count}}
The second view is keyed on event_id and contains the dimensions and measures used for analyzing and counting playback events by those listeners’ devices.
-- page events view definitionview: page_events {derived_table: {sql: SELECTREPLACE(JSON_EXTRACT(e.properties,'$.Episode'),'"','') AS episode,REPLACE(JSON_EXTRACT(e.properties,'$.url'),'"','') AS nav_url,episode_number,distinct_id,current_url,event_id,initial_referrer,initial_referring_domain,name as event_type,referrer,referring_domain,search_engine,timeFROM`aerial-vehicle-148023.mixpanel.event` eleft outer join `aerial-vehicle-148023.dw_staging.episode_list` lon REPLACE(JSON_EXTRACT(e.properties,'$.Episode'),'"','') = l.episodeWHEREe.name IN ('Clicked Nav Link','Podcast Episode Played') ;;}dimension_group: event {type: timetimeframes: [date,week,month,hour_of_day,day_of_week,day_of_month]sql: ${TABLE}.time ;;}dimension: event_type {}dimension: event_id {primary_key: yeshidden: yes}dimension: distinct_id {hidden: yes}dimension: episode {sql: replace(${TABLE}.episode,'Drill to Detail','') ;;}dimension: episode_number {sql: lpad(cast(${TABLE}.episode_number as string),2,'0') ;;}dimension: nav_url {}dimension: referring_domain {}dimension: search_engine {}measure: event_count {type: count}measure: unique_device_count {type: count_distinctsql: ${TABLE}.distinct_id ;;}measure: unique_devices {type: count_distinctsql: ${TABLE}.distinct_id ;;}measure: episode_num {type: averagesql: ${TABLE}.episode_number;;}}
Then, a new explore is defined within the LookML project to join these two views and make them available for analysis in the Looker Explore page.
-- explore definitionexplore: page_events {join: unique_devices {relationship: one_to_manysql_on: ${page_events.distinct_id} = ${unique_devices.distinct_id} ;;}}
Creating a look similar to the one a moment ago but using episode play events recorded by Mixpanel as the measure, I can see that whilst most episodes had the majority of downloads in the month they were published, the episode featuring Jonathan Palmer from King Games on how they used Looker to design and optimize games such as Candy Crush Saga had downloads well after the initial month it became available, telling me that content on this type of topic has perhaps a longer “shelf-life” than others we’ve covered.

1_-Ow4UumPL1f-PWYrEu2kQQ.png
If I use the “merge results” feature introduced with Looker 5 to combine results from two or more queries, I can combine the download numbers per episode per month per unique device ID from both Apple and from Mixpanel’s tracking of plays on the website to give me a combined listener count for each episode, and you can see from the screenshot below that the Episode 50 Special is still the most downloaded episode and the later one with Jonathan Palmer does seem to still be listened to for a lot longer than most other episodes.

1_BLGORMX1o0bXwXrJk0nvBQ.png
Except it’s not. What the chart above actually shows is that Episode 50 was the most downloaded in any one month, but if you take each episode and chart total downloads overall it’s actually the Christmas and New Year Special featuring Christian Berg that overall had more unique device downloads.

1_tsGaA0vUlcjDVgvdGlSokw.png
Putting the above two merged data looks into a dashboard along with two others showing the split by iTunes and website downloads over time and those same numbers expressed as share of all downloads over time, you can get a sense of for how long each episode was downloaded after first publication, the split for each episode by download platform and how listener numbers for each method of download have changed over time. You can see next chart how downloads via iTunes have a close correlation with new episodes being published with listener numbers dropping over the summer when the show took a break; in contrast, downloads directly from the website held-up even over the summer break when no new episodes were published.

1_Zhmt6XPbKfHoAhy0wpsj7A.png
Taking just the device-level data for website downloads coming from Mixpanel and creating a dashboard from the referrer and device details attributes it confirms as I’d have expected that most of those downloads come from listeners using Windows desktop PCs or Android phones, given iTunes’ focus on MacOS and iOS devices, but I can also see that most plays coming from search traffic come from Google and occasionally from Bing, and that Christian Berg’s listeners were unusually-spread amongst lots of different countries, not just the usual UK, USA, Germany and so on.

But what none of these dashboards tell me is how good I am at retaining listeners after they’ve downloaded their first ever episode; although I suspect many listeners come for one particular episode I’d be interested to know how many devices we see each month are returning or new and we can of course extend the scope of website activity to include clicks on navigation links as another indicator of engagement and retention.
To do this we need to know, for every visitor unique device ID, what sequence number in the total set of episode plays for that device this particular play represents; if the sequence number for a given play event was 1 then we’d classify the visitor as new, whereas if the sequence number was greater than 1 then we’d classify the visitor as returning. Sequencing these device playback events also then makes it possible to analyze play histories for individual podcast listener devices to understand how many episodes a typical listener plays and whether a particular episode triggers more repeat listenings of the show than others, to understand the frequency of listening and whether returning visitors are coming back to play the same episode or taking the opportunity to discover and play other episodes from the site — exactly the sort of analysis that online retailers do when looking to turn casual browsers and one-off purchasers into loyal, repeat buyers from their site.
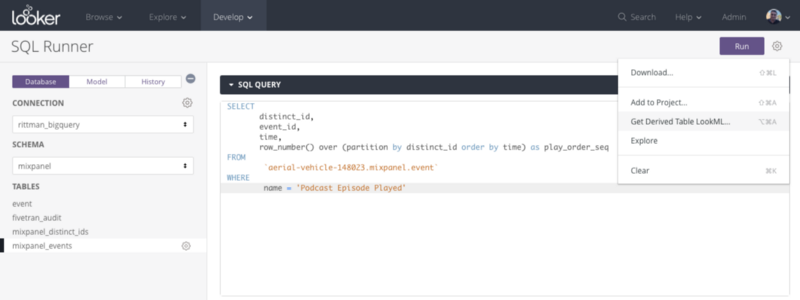
To do this I create an SQL query in Looker’s SQL Runner utility that returns the episodes played for each visitor distinct_id and adds a ROW_NUMBER window function to provide a sequence number for the episode plays sorted in order of time
To add this query to my Looker project as a derived table I then select Get Derived Table LookML from the menu in the top right-hand side of the page, like this:
SELECTdistinct_id,event_id,time,episode_number,row_number() over (partition by distinct_id order by time) as play_order_seqFROM`aerial-vehicle-148023.mixpanel.event` eLEFT OUTER JOIN `aerial-vehicle-148023.dw_staging.episode_list` lON REPLACE(JSON_EXTRACT(e.properties,'$.Episode'),'"','') = l.episodeWHEREe.name = 'Podcast Episode Played'
1_jxWHFDG70QuKg8eLgcgkOg.png
and then choose the option to add it to your project when the Get Derived Table LookML dialog is shown.

1_9DraJHEWp0IpUSzZ1i6i0w.png
Then, after setting all of the derived table columns as hidden and the event_id column as the primary key for this view, I add one new dimension to the view that returns “new” or “returning” depending on whether the play order sequence number for the play event is 1 or any other number and also set the view_label for this view to the same name as the main page events view, so that the play order sequence number appears alongside the other play event fields in the main explore view.
view: website_play_sequence {view_label: "Page Events"derived_table: {sql: SELECTdistinct_id,event_id,time,row_number() over (partition by distinct_id order by time) as play_order_seqFROM`aerial-vehicle-148023.mixpanel.event`WHEREname = 'Podcast Episode Played';;}dimension: distinct_id {hidden: yestype: stringsql: ${TABLE}.distinct_id ;;}dimension: event_id {hidden: yesprimary_key: yessql: ${TABLE}.event_id ;;}dimension_group: time {hidden: yestype: timesql: ${TABLE}.time ;;}dimension: play_order_seq {type: numbersql: ${TABLE}.play_order_seq ;;}dimension: new_or_returning {type: stringsql: case when ${TABLE}.play_order_seq = 1 then 'new' else 'returning' end ;;}}
I then join this new derived table to the page events view in the existing model explore on the event_id column common to both of them, like this:
explore: page_events {join: unique_devices {relationship: one_to_manysql_on: ${page_events.distinct_id} = ${unique_devices.distinct_id} ;;}join: website_play_sequence {relationship: one_to_manysql_on: ${page_events.event_id} = ${website_play_sequence.event_id} ;;}
Now I can create a look that shows episode play events over time broken down by new or returning device, and I can see that about two-thirds of listens each month come from returning devices.

1_mdxRGHXwcEc8oZkmNL1DQg.png
If we pivot on the episode play sequence number and then turn the episode numbers themselves into a measure, we can then show for each individual device the sequence of episodes they’ve downloaded.

1_RfWkCwlRnmufmY6YZ9PuGA.png
So far we’ve looked at devices playing podcast episodes on the site as one, homogenous group, working on the assumption that listeners visiting the site for the first time now are no different from ones who found us a year or more ago, and the site itself hasn’t changed over that period of time.
But in reality we may have improved the usability of the site or made it easier for visitors to find and discover other episodes, and so I’m keen to understand whether the groups, or “cohorts” of users who joined us in more recent months are engaged for longer and churn at a slower rate than visitors who found the site before those changes were made.
I can return the month that each visitor’s device first played a podcast episode on the site using another SQL query, and whilst I’m pulling this together I might as well calculate how long each device has been accessing episodes on the site along with totals for episode play events and distinct episodes listened to for each visitor device.
SELECT distinct_id,date_trunc(date(min(time)),MONTH) as first_visit_at,timestamp_diff(max(time),min(time),day)+1 as listener_days,count(*) as total_plays,count(distinct JSON_EXTRACT(properties,'$.Episode')) as total_episodesFROM mixpanel.eventWHERE name = 'Podcast Episode Played'GROUP BY 1
I then use the feature in SQL Runner that generates a derived table view definition from an SQL query and then fine-tune the dimension definitions and convert the listener_days, total_plays and total_episode columns into a set of appropriate measures.
view: visitor_cohort {view_label: "Unique Devices"derived_table: {sql: SELECT distinct_id,date_trunc(date(min(time)),MONTH) as first_visit_at,timestamp_diff(max(time),min(time),day)+1 as listener_days,count(*) as total_plays,count(distinct JSON_EXTRACT(properties,'$.Episode')) as total_episodesFROM mixpanel.eventWHERE name = 'Podcast Episode Played'GROUP BY 1;;}dimension: distinct_id {primary_key: yeshidden: yestype: stringsql: ${TABLE}.distinct_id ;;}dimension: first_visit_at {type: datelabel: "Listener Cohort"sql: ${TABLE}.first_visit_at ;;}measure: listener_days {type: averagesql: ${TABLE}.listener_days ;;}measure: avg_episode_plays {type: averagesql: ${TABLE}.total_plays ;;}measure: total_episode_plays {type: sumsql: ${TABLE}.total_plays ;;}measure: avg_episodes {type: averagesql: ${TABLE}.total_episodes ;;}}
Then I join this second derived table into the model explore, this time joining to the unique_devices view on their common distinct_id column as the additional columns I’m now adding in apply to visitor devices, not episode play events as in the previous example.
explore: page_events {join: unique_devices {relationship: one_to_manysql_on: ${page_events.distinct_id} = ${unique_devices.distinct_id} ;;}join: website_play_sequence {relationship: one_to_manysql_on: ${page_events.event_id} = ${website_play_sequence.event_id} ;;}join: visitor_cohort {relationship: one_to_onesql_on: ${unique_devices.distinct_id} = ${visitor_cohort.distinct_id} ;;}}
I can now create looks such as the one below, where I chart the size of each cohort and overlay the average number of episode each visitor device goes on to download to give me a combined view of how many new listeners we recruit each month and whether each group over time listens to more, or less episodes than the previous ones.

1_Q7Rf49igY6Mg6fzKBV9aGw.png
If I now add two more window function calculations to the SQL query used by the derived table that provides the sequence number for each episode play by a device, like this:
SELECTdistinct_id,event_id,time,row_number() over (partition by distinct_id order by time) as play_order_seq,date_diff(date(time),date(first_value(time) over (partition by distinct_id order by time)),MONTH) as months_since_first_play_at,date_diff(date(time),date(lag(time,1) over (partition by distinct_id order by time)),DAY) as days_since_last_playFROM`aerial-vehicle-148023.mixpanel.event`WHEREname = 'Podcast Episode Played'
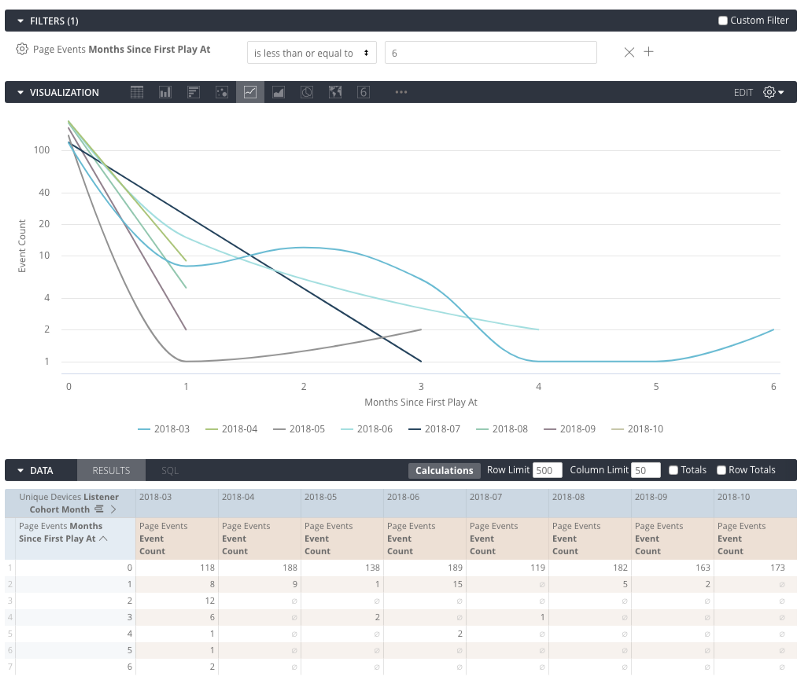
I can now create a heat-map for each cohort showing how their engagement maintains or falls-off for the six months after their first play of a podcast episode on the site.

1_ipWdMIM607Rkmxh2OOMFFQ.png
If I switch the two dimensions around and change the visualization type to a line chart using a logarithmic scale, you can now see how engagement falls-off (or “decays”) for each of my listener cohorts over the six months since they first play an episode on the site.
1_GfyCbXM4O1oOZWkq37ewyA.png
Or, finally, I could take the Days Since Last Episode Play measure and use it to show how time between episode plays increases for each cohort, with big increases in time elapsed being a strong indicator of that cohort losing interest in the podcast and “churning”.

1_35JXcKGt5uEuweMBUDbvjw.png
So whilst we’ve been analyzing listeners to a podcast and in-detail, only a small and perhaps skewed subset of overall listeners, the techniques we’ve used including cohorting visitors based on when they first download or purchase and then tracking their engagement and overall lifetime value are ones we’ve used recently when working on Looker projects for clients such as Colourpop in the US and Florence back home in the UK.
Drop us an email at [email protected] or contact us on +44 7866 568246 if you’re looking to do something similar with your customer or product data, and in the meantime you can check out past episodes of the Drill to Detail podcast a the new home for the show, co-located with this blog on the MJR Analytics site at https://www.mjr-analytics.com/podcast.