How Rittman Analytics uses AI-Augmented Project Delivery to Provide Value to Users, Faster
Our latest case study features Barton Peveril College in Eastleigh, UK and the AI-augmented delivery approach we used to ship their Looker and Google Cloud MVP platform in December 2025.
Over the past year we’ve quietly changed how we deliver analytics projects — not by replacing consultants with AI and not by promising instant dashboards at the click of a button. Instead, we’ve used tools like Claude Code and Google Gemini to remove friction from the parts of delivery that slow teams down and divert attention from stakeholders and end-users.
This post explains what has changed, what hasn’t and why it matters for teams building analytics platforms today.
The problem with traditional analytics delivery
Most analytics projects fail or stall for predictable reasons. Requirements take too long to surface. Early designs are abstract and hard to react to. Delivery teams spend weeks translating intent into code before anyone sees value.
A typical engagement might involve two weeks of requirements gathering, another two weeks of data-modelling design, then four to six weeks of build — potentially ten weeks before stakeholders see a working dashboard. By then the business has often moved on.
The problem isn’t technical skill; it’s delayed feedback. When stakeholders finally see their dashboards, they inevitably say “that’s not quite what I meant” or “we need to slice this differently.” These aren’t communication failures — they’re the natural result of specifying complex analytical requirements through documentation rather than working software.
AI-Augmented Analytics Delivery
Barton Peveril Sixth Form College is a long-established, Ofsted Outstanding post-16 institution serving nearly 5,000 students. In 2024 it became the UK’s first Google Gemini Academy while undertaking a broader shift toward data-driven decision making.
With a director demonstration scheduled for early January and just 19 working days available, Barton Peveril needed a partner who could deliver enterprise-quality analytics at startup speed.
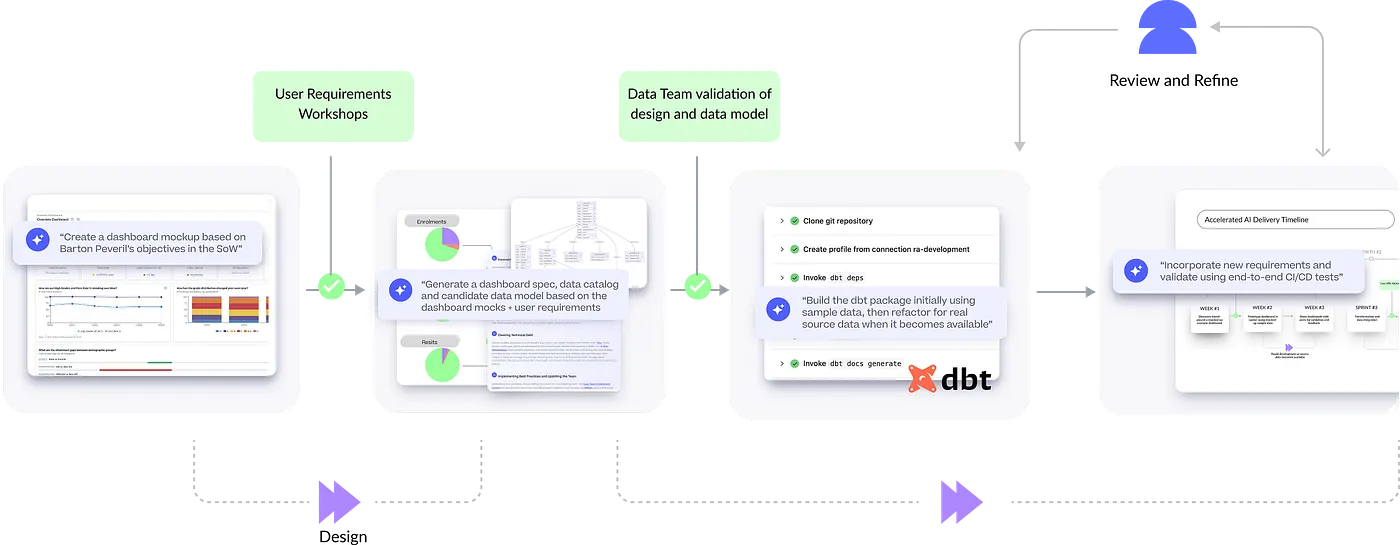
Early visualisation and design
The evening before our first kick-off meeting, we generated ultra-realistic dashboard mockups directly from our statement of work and existing knowledge of higher-education analytics needs.
Built using Loveable, an AI-powered platform that creates full-stack web applications from natural-language prompts that we’ve integrated into our delivery process via their API, these mockups made requirements concrete immediately, letting stakeholders react to something tangible rather than hypothetical.
The mockups weren’t throwaway artefacts. They served as design references throughout the build, ensuring the final LookML dashboards matched expectations. By the time we delivered working dashboards, there were no surprises — everyone had already seen and approved the direction.
Accelerated data modelling and build
AI-assisted generation helps us scaffold dbt models, semantic layers and tests far faster than coding by hand. This doesn’t remove the need for good modelling judgment, but it eliminates the mechanical work that historically meant weeks passed before clients saw anything they could provide feedback on.
We’ve developed a workflow using Claude Code (soon to-be extended to Gemini CLI) that starts with requirements documents in a GitHub repo. From there we create dashboard specifications, data catalogs and data models based on Claude agent Skills that define our working practices, coding standards and required tests.
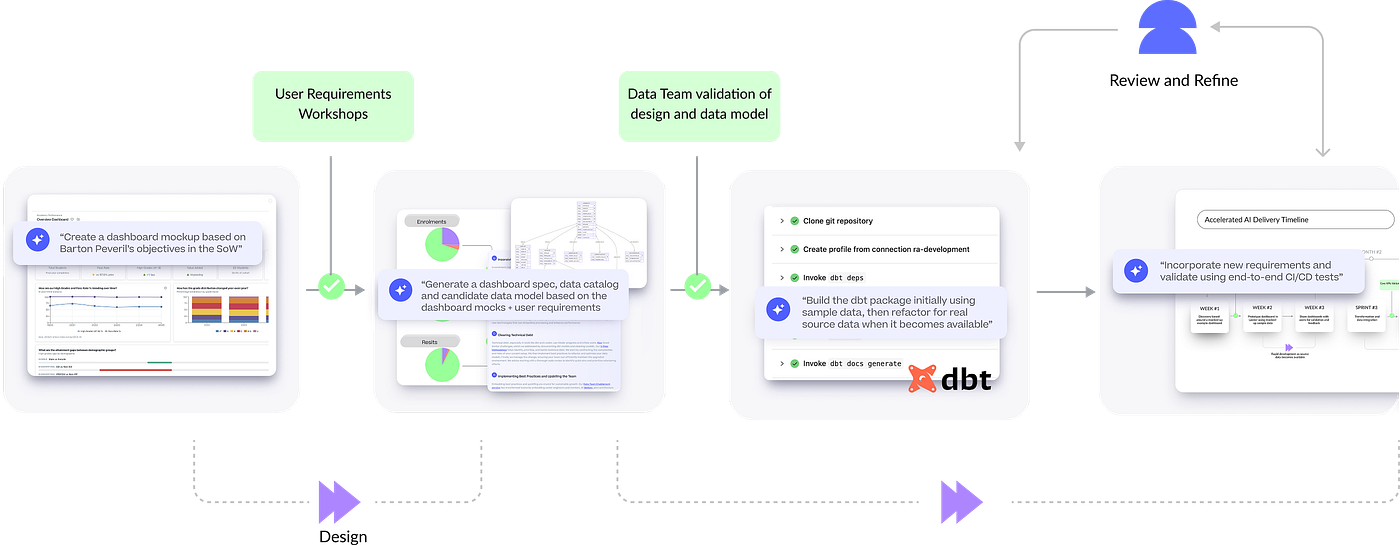
Once a consultant reviews and signs off these artefacts, we use them to build the full dbt package structure, from staging through integration to the warehouse layer, complete with internally consistent sample seed data for testing.
Automated Looker Development & Testing using MCP Toolbox
We’ve also developed a Claude Skill defining a complete workflow for AI-assisted Looker development, from initial specification through to validated deployment. It guides Claude Code through a ten-phase process: understanding requirements, examining existing patterns, generating LookML views, explores and dashboards locally, then deploying to Looker via its Toolbox MCP server so it can test every artefact before releasing to production.
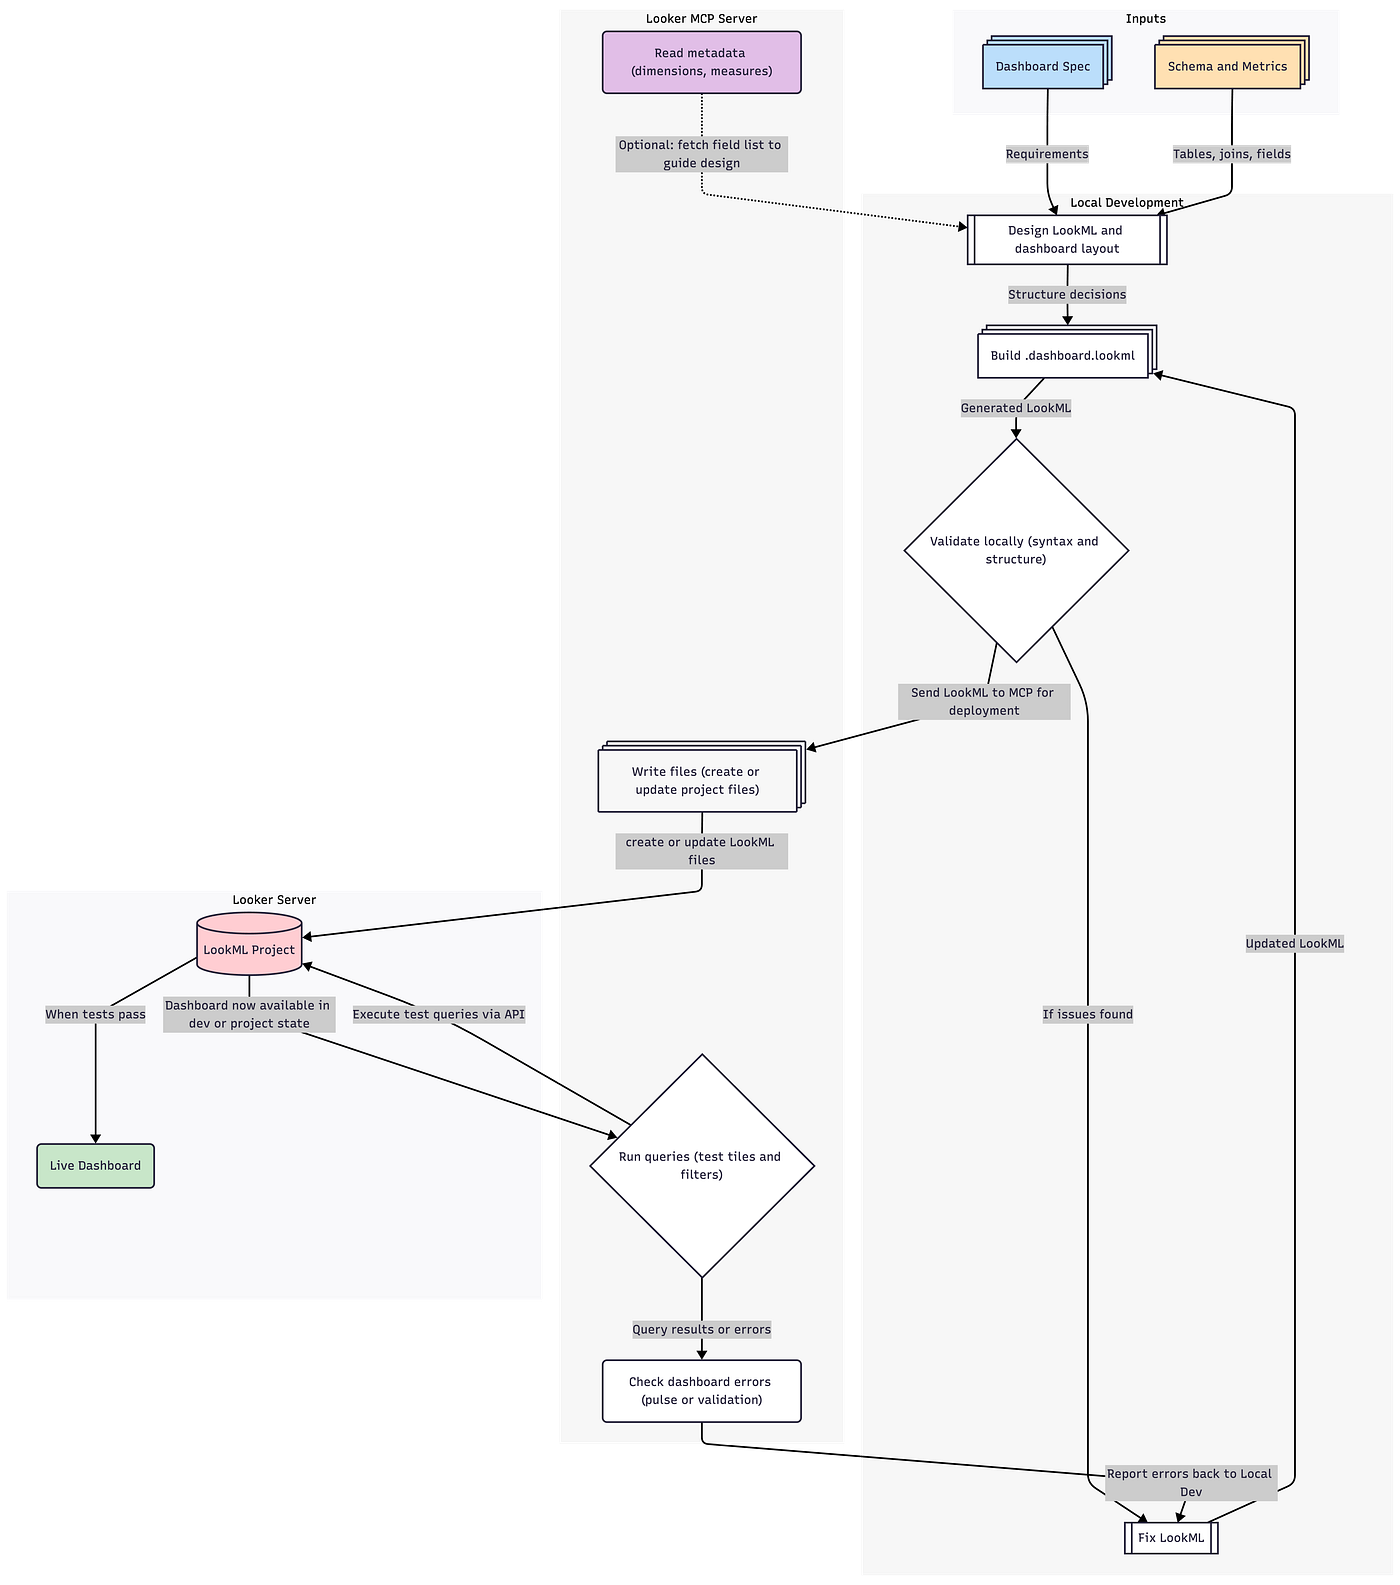
The result is a repeatable, testable approach where dashboards are guaranteed to work before being committed, with batch-deployment support for rolling out entire dashboard suites from specification documents.
You can read more about our approach on our AI-Augmented Analytics Delivery services page, along with more details on the work we did for Barton Peveril College.
What hasn’t changed
Several things remain non-negotiable in our delivery approach — and arguably matter more when AI is involved.
Every piece of logic we deliver must be explainable by a consultant to a client. When asked why a particular student appears in a cohort count, we can trace the answer through documented business rules in the dbt models.
Human review gates still exist before anything goes client-facing. Every dbt model, every LookML view and every dashboard was reviewed by a consultant before deployment. AI accelerates initial versions; humans ensure those versions are correct and appropriate.
Semantic design still requires judgment and experience. The decision to implement SCD Type 2 tracking on the student dimension — so the college can analyse how outcomes vary for students whose circumstances change year to year — wasn’t made by AI. It came from conversations with users and their data team about the analytical questions they needed to answer.
Business meaning still comes from conversations, not prompts. When we learned that “Access Plus” at Barton Peveril means students who are educationally disadvantaged, have SEN or access arrangements, or receive pupil premium or free college meals, that understanding came from stakeholder discussions. Claude Code couldn’t have inferred that definition from the source data.
Why this changes the client experience
The biggest difference clients notice isn’t speed for its own sake — it’s that value appears earlier. Conversations happen around real artefacts rather than abstract documents. Iteration becomes cheaper and safer. More time goes to aligning on meaning.
For Barton Peveril, this meant staff saw working dashboards in the first week and started providing feedback immediately through daily interaction with the college’s MIS and data teams. AI-augmented delivery didn’t reduce that collaboration; it made it more productive by ensuring every conversation happened around working software.
Interested? Find out more!
Rittman Analytics is a boutique data analytics consultancy that helps ambitious, digital-native businesses scale-up their approach to data, analytics and generative AI.
We’re authorised delivery partners for Google Cloud along with Oracle, Segment, Cube, Dagster, Preset, dbt Labs and Fivetran and are experts at helping you design an analytics solution that’s right for your organisation’s needs, use-cases and budget and working with you and your data team to successfully implement it.
If you’re looking for some help and assistance with your AI initiative or would just like to talk shop and share ideas and thoughts on what’s going on in your organisation and the wider data analytics world, contact us now to organise a 100%-free, no-obligation call — we’d love to hear from you!
Recommended Posts
How Rittman Analytics uses AI-Augmented Project Delivery to Provide Value to Users, Faster
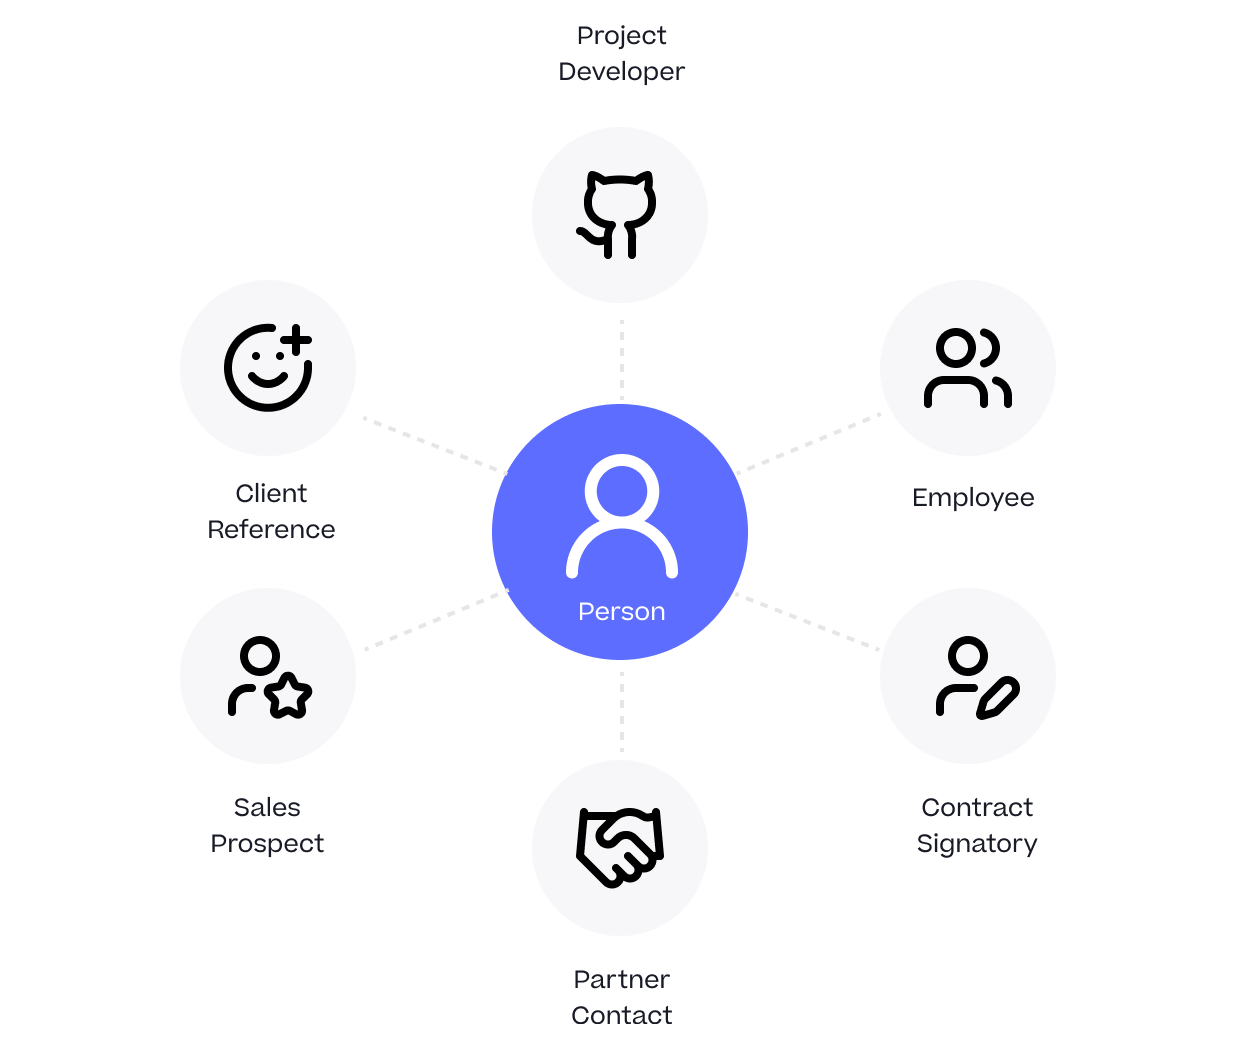
One Person Many Roles: Designing a Unified Person Dimension in Google BigQuery
Rittman Analytics 2025 Wrapped : A Year of Platforms, People and High-Performing Data Teams